The VVIX Is Paying for a Volmageddon: VIX Options, Contango, and Positioning into October 2026
Spot VIX at 16.23 tells you the equity market is priced for calm. Everything one layer beneath the surface tells you the opposite. VVIX at 93.53, a steep contango that lifts the October futures into the low 20s, a call skew that runs upward to 112 per cent implied vol, and a 272,603-lot open interest wall sitting at the 65 strike are not the fingerprints of complacency. They are the fingerprints of a market quietly paying up for a tail. This is the configuration I have learned to respect, because it is what the tape looks like in the weeks before a short-vol complex unwinds. I expect another volmageddon, and I want to explain precisely why, and why the structure has to be traded off the futures rather than the 16 handle on the screen.
1. The signal is not spot, it is the vol of vol
The single most useful number on my screen this morning is not the VIX, it is the ratio of VVIX to VIX. At 93.53 over 16.23, that ratio is close to 5.8. Spot VIX says near-term equity risk is subdued. VVIX, the volatility of the volatility, says the market is paying a rich premium for convexity in VIX options themselves. Those two statements are only reconcilable one way: someone with size is buying insurance on the insurance. Tail hedgers and vol traders are active and genuinely uncertain about the regime, and they are expressing that uncertainty where it is cheapest to be wrong on carry and most convex to be right on a shock. When spot vol is asleep and vol-of-vol is awake, the calm is not consensus, it is a standoff.
2. You are not trading 16, you are trading 20
This is the point where most people mis-size the trade. VIX call spreads are priced off the futures, not off spot, and the futures are in steep contango.
| Contract | Price | Spread to prior |
|---|---|---|
| Spot | 16.23 | |
| UX1 (front) | 17.00 | +0.77 vs spot |
| UX2 | 18.35 | +1.35 |
| UX3 | 19.40 | +1.05 |
| UX4 | 20.32 | +0.92 |
| UX5 | 20.60 | +0.28 |
| UX6 | 20.69 | +0.09 |
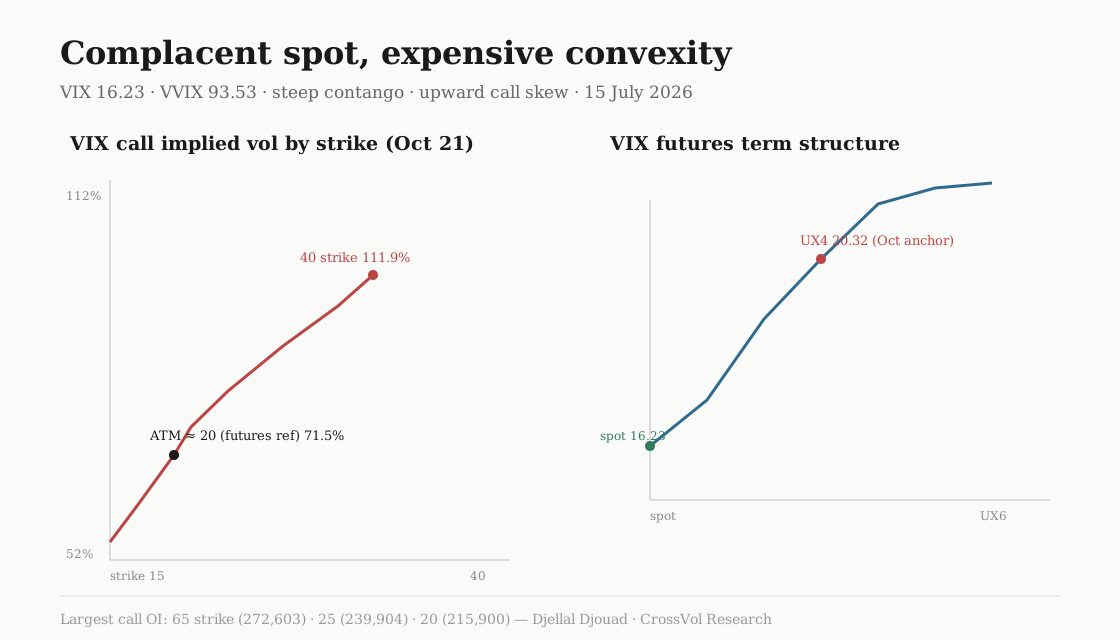
For a roughly 97 day structure expiring around 21 October, the relevant anchor is close to UX4 at 20.32. Read that again, because it reframes the whole trade. Your effective at-the-money for October VIX options is near 20 to 20.50, not the 16.23 you see on the spot ticker. A call struck at 20 is not out of the money, it is at the money on the instrument you are actually trading. The contango is a structural headwind for anyone holding long VIX calls naked, because the future rolls down toward spot as time passes if nothing happens. That roll-down is precisely the carry that the short-vol complex has been harvesting, and it is precisely what makes the unwind so violent when it reverses.
3. The skew runs the wrong way
Equity index options carry a downside put skew. VIX options do the opposite. The call skew is strongly upward-sloping, and the further out of the money the call, the richer its implied vol.
| Strike | Implied vol | vs ATM (~20) |
|---|---|---|
| 15 | 52.3% | -19.2 pts |
| 17 | 60.2% | -11.3 pts |
| 20 | 71.5% | ATM (futures ref) |
| 22 | 77.8% | +6.3 pts |
| 25 | 85.6% | +14.1 pts |
| 30 | 95.4% | +23.9 pts |
| 35 | 104.5% | +33.0 pts |
| 40 | 111.9% | +40.4 pts |
An implied vol of 112 per cent on the 40 strike is the market telling you that a move from 20 to 40 is not a two standard deviation curiosity, it is a live scenario that people are willing to pay a fortune to own. That is the convexity premium embedded in tail-risk hedging demand, and it is the same premium VVIX was flagging in the first section. The practical consequence is that buying the far-upside call outright is expensive, and the cleaner expressions are structures that sell some of that rich upside skew back to the market: call spreads and call ratios anchored around the futures, or calendars that lean on the fact that this skew compresses with tenor.
4. Why the 97 day tenor matters
The at-the-money term structure of VIX implied vol is downward sloping. Thirty day ATM is 86.6 per cent, sixty day is 78.8, and the generic ninety day is 73.6. The twenty five delta skew, measured as ninety per cent moneyness minus one hundred and ten, is deeply negative and compresses as you extend out: minus 36.5 points at thirty days, minus 18.0 at sixty, minus 15.0 near ninety. In plain terms, the nearest expiries carry the richest and most convex skew, and it flattens as you move toward the October tenor. That is why a 97 day structure behaves differently from a one month hedge. You give up some of the explosive short-dated convexity, but you also pay a lower skew tax, and you buy time for the catalyst to arrive without being run over by daily theta on a front-month position. For a view that is about regime rather than a single event date, the longer tenor is the more honest expression.
5. The positioning tell: a wall at 65
Open interest is where narrative becomes commitment. On the nearest liquid expiry, 22 July, the call side is stacked exactly where you would expect if the market were positioning for a spike.
| Calls (strike / OI) | Puts (strike / OI) |
|---|---|
| 65 → 272,603 | 17 → 184,258 |
| 25 → 239,904 | 18 → 112,034 |
| 20 → 215,900 | 19 → 101,011 |
| 30 → 159,503 | 15 → 66,590 |
| 28 → 108,405 |
The 65 call with 272,603 contracts of open interest is the line that stops me. Nobody funds a position of that size at a strike four times spot because they think it will finish in the money in the base case. They fund it because the payoff if VIX does explode is so convex that a small, cheap, high-delta-at-the-tail bet dominates the book. That is a deliberate volmageddon hedge, or a volmageddon bet, depending on who holds it. Meanwhile the put open interest clusters at 15 to 19, which is simply the short-vol crowd financing carry by selling the downside that contango is already pulling them toward. You have, in one options chain, both sides of the reflexive trade that blew up in February 2018: a crowded short-vol carry on one wing, and a concentrated tail bet on the other.
6. Why I expect another volmageddon
Volmageddon is not a price, it is a mechanism. It happens when a large, crowded short-volatility position, harvesting contango roll-down and selling convexity, is forced to cover into a shock. The covering is itself buying of volatility, which lifts the future, which forces more covering. The 2018 episode terminated an inverse VIX product overnight because the rebalancing math became reflexive. Every ingredient for that mechanism is visible in the numbers above. Spot is low enough that short-vol carry looks attractive and crowded. The contango is steep enough that the roll-down is a real income stream, which is exactly what pulls size into the short. The upward call skew and the VVIX premium show that the other side of the market is already paying for the convexity that a cover would demand. And the 65 call wall shows that at least one participant has sized for the discontinuity rather than the drift.
I am not calling a date. Nobody who has sat on a desk through one of these would. What I am saying is that the configuration is loaded, and that the honest way to be involved is on the long-convexity side, expressed off the October futures near 20 rather than off a spot print of 16, and structured to survive the contango bleed while the catalyst forms. Call spreads and ratios that finance the rich upside skew, calendars that exploit the term-structure and skew compression, and a clear-eyed acceptance that the carry works against you until the day it does not. This is research and a personal desk view, not investment advice, but it is the view I am carrying: the market is priced for calm and positioned for a break, and those two facts do not coexist for long.
Addendum: the volume tell, the macro backdrop, and structuring the trade
The open interest map above is the standing position. Today's volume is the flow moving through it, and it points to something more immediate than tail hedging. Activity is concentrated in near-term calls in the 27 to 34 range rather than in the deep-out-of-the-money strikes.
| Call strike | Volume today | Read |
|---|---|---|
| 34 | 11,788 | Active near-term upside |
| 33 | 8,522 | Same cluster |
| 27 | 8,305 | Lower edge of the range |
| 19 | 6,441 | Near the futures |
The 20 to 30 open interest plus the 65 wall was near-ATM directional positioning sitting alongside far-OTM tail hedges. The volume today leans into fresh near-term call buying in the 27 to 34 range. It fits the wider picture: call contract activity has been at record highs, with call volume up 36.2 per cent year over year as of May. One honest caveat on the data, the open interest and volume I am reading cover the first 100 rows of a truncated 240 row dataset, so the full chain across every strike and expiry may shift the detail even if it does not change the shape.
The macro backdrop that keeps the vol-of-vol bid
The sentiment tape explains why VVIX stays firm while spot VIX drifts lower. The CNN Fear and Greed index sits in the Fear zone even though the Nasdaq added more than 200 points on a softer than expected CPI print today. That is the tell: price is relieved, positioning is not. Layer in the geopolitical risk that has not gone away, the US and Iran standoff and the Strait of Hormuz, and you have a live tail that keeps hedgers paying for convexity even as the front of the curve relaxes. This is exactly the configuration where spot can drift down while the vol-of-vol refuses to follow.
Structuring a 97 day call spread or ratio
If the view is a regime break rather than a single dated event, the structure has to respect four things at once: the futures anchor, the steep call skew, the vol-of-vol, and the contango bleed. Here is how I frame each, as reasoning rather than a recommendation.
Anchor off the futures, not spot. The October expiry trades against UX4 near 20.32, so strikes should be set relative to 20, not to a spot print of 16.23. A 20 call is at the money on the instrument you actually hold.
Prefer a spread to an outright. The call skew is steep and expensive, with OTM strikes at 25, 30 and 35 carrying roughly 85 to 105 per cent implied vol. A vanilla call spread, for example long the 20 and short the 25 or 30, cuts the premium outlay and, crucially, sells rich vol on the upper leg. When skew is this rich, the spread is structurally favoured over the outright.
The ratio logic, and its trap. Because the upward skew is so steep, selling a higher ratio of OTM calls, a 1 by 2 or 1 by 3 at the 30 to 40 strikes where implied vol runs 95 to 112 per cent, can shrink or fully finance the net premium. The catch is that the risk is uncapped above the short strike if VIX gaps higher, which is a real hazard given the geopolitical backdrop. This is not a free carry, it is short convexity dressed as a cheap entry.
VVIX is the caution flag. Vol-of-vol at 93.53 means the distribution of VIX outcomes is wide. A ratio is short gamma above the upper strike, exactly where a VVIX-driven spike would hurt most. If the ratio is used at all, cap it, or buy a far-OTM long call as a wing so the tail is defined rather than open.
Contango is the clock. If VIX stays range-bound, the future rolls from about 20.32 down toward spot near 16, which rewards the put sellers and bleeds the naked call buyer over time. A spread or a capped ratio mitigates that drag far better than an outright long call. Call spreads are broadly the efficient expression when the call skew is flat to rich and implied vol is elevated.
None of this changes the thesis. It sharpens the expression of it. The market is priced for calm, positioned for a break, and the honest way to hold that view is a defined-risk long-convexity structure anchored on the October future, sized to survive the carry until the catalyst arrives. This remains research and a personal desk view, not investment advice.
Who is on the other side: the dealer vega inventory
Every one of those long call positions has a seller, and the seller is the dealer. To understand where this regime can break, I have to look at what the dealer complex is carrying. Start with the aggregate open interest across the whole VIX options book.
| Side | Open interest | Share of total OI |
|---|---|---|
| Calls | 9,490,700 | 72.6% |
| Puts | 3,588,937 | 27.4% |
| Total | 13,079,637 |
The call to put open interest ratio sits at 2.64 times, a heavily call-skewed book. That is structurally normal for VIX, where end users buy calls as tail hedges, but the magnitude here matters because it dictates which way the dealer is leaning. If the street has sold the bulk of those calls, the street is short the convexity that everyone else owns.
| Greek (OI-weighted) | Calls | Puts | Net (calls minus puts) |
|---|---|---|---|
| Vega x OI x 100 | 12,416,878 | 6,971,931 | +5,444,946 |
| Gamma x OI x 100 | 5,232,971 | 5,603,115 | -370,145 |
Here is the number that reframes the whole picture. Dealers are net short vega by roughly 5.4 million units across the VIX complex. With the market overwhelmingly long VIX calls at 2.64 times the puts, dealers sit on the other side, having sold the bulk of that convexity. Short vega means they need VIX to stay low or fall to make money on the position, and it means they are structurally motivated to sell any vol rally. That is the mechanical source of the vol suppression that keeps spot pinned at 16 while the curve prices 20.
The gamma picture is different, and it is the tell I care about most. Dealers are only modestly net long gamma, about 370,145 units, because the near-the-money puts they hold carry slightly more gamma than the mostly out-of-the-money calls they are short. That marginal long gamma means dealers are gently damping the tape rather than being forced to chase spot VIX in either direction for their delta hedging today. That is the calm. But it is a conditional calm. The book is call-heavy, so a sharp VIX spike flips that gamma from long to short quickly, and a dealer who was comfortably damping the move becomes a dealer who has to buy into a rising market. A marginally long gamma sitting on top of a large short-vega, call-heavy book is not stability. It is a coiled spring.
The forces that suppress vol until they do not
Four structural forces are holding the regime together, and each one is a reason the calm persists right up until it snaps.
Short dealer vega plus steep contango is a vol-suppression engine. Dealers who are short vega are paid to sell vol into any spike, which mechanically reinforces the contango from UX1 at 17.00 up to UX4 at 20.32. The positioning and the curve feed each other, and the result is a persistent dampener on realized vol.
Defined-outcome ETFs, around 90 billion dollars in assets, add a long-vega overhang. Put spread collars and upside caps leave the dealer long vega from the structured product side, which partly offsets the short from VIX call sales. The net effect has been to keep vol contained even during risk-off episodes, which is why shocks have so far been absorbed rather than amplified.
The convexity bid is real even so. VVIX at 93.53 against a VIX of 16.23 tells you end users are still paying up for convexity despite the low spot, consistent with a large outstanding call book that is being rolled and added to rather than closed.
The calm is a single index-level illusion. Single-stock volatility is historically elevated relative to index vol, with QQQ one-month implied vol near its 99th percentile against SPY. The index-level quiet is masking real dispersion underneath, and that dispersion is exactly what keeps the structured hedging bid alive. At the same time, broad hedging demand has faded as the S and P 500 rallied around 10 per cent year to date, so the natural put buying that would normally balance the dealer book is thinner than usual. A book that is under-hedged on the downside is a book that moves faster when it finally has to move.
What the dealer inventory means for the ratio
This positioning layer changes how I read the structuring choices from the section above.
Dealers short vega are a structural seller into vol spikes, which is a genuine headwind for any outright long-vega position. If VIX pops, the dealer flow of buying back short vega can be offset by their standing tendency to sell the rally. A call spread or a ratio limits your net vega versus an outright long call, which is the appropriate posture in a regime where the street is leaning against you. The small net long gamma, about 370,145, tells me dealers are not in a destabilising squeeze today, so a disorderly hedging cascade would need a genuinely sharp move to start. That is the difference between this setup and February 2018. The fuel is in place, the spark is not lit yet.
There is one nuance that cuts against the ratio, and I want to be honest about it. When you sell the upper leg of a ratio, you are adding to the existing dealer short-vega precisely at the higher strikes where the street is already short. You are joining the crowded side of the boat at the exact point where a VVIX-driven spike does the most damage. That is why, if the ratio is used at all, the far-OTM wing is not optional. In a market where dealers are short 5.4 million vega and gamma is one shock away from flipping, defined risk is the only version of this trade I would carry.
There is a scenario where this positioning turns violent. If a genuine tail event materialises, a geopolitical escalation or a credit event, the short-vega dealer community faces a simultaneous squeeze. That cuts both ways for a ratio. It amplifies the move in your favour on the long leg, but it also accelerates the losses on the uncapped short legs at exactly the moment the dealer scramble is most disorderly. The VVIX at 93.53 is the market pricing precisely this risk, and it is why I treat the upper strikes with respect rather than greed.
My preferred expression is a 1 by 2 capped ratio. Buy one call, sell two, and buy one far out-of-the-money call as a wing. The wing neutralises the uncapped tail that a dealer short-squeeze would otherwise open up, and it converts an open-ended short-convexity bet into a defined-risk structure that still finances most of its premium off the rich upper skew. In a market where dealers are short 5.4 million vega and one shock away from a gamma flip, that wing is the difference between a position I can hold through the storm and one that holds me.
Sources
- All Options Considered, Volatility Forum Singapore 2026, BI Transcript, 2 July 2026
- Call Volume Surge Drives Put/Call Ratio to 0.67, Research, 17 June 2026
- Nasdaq Gains Over 200 Points Following Inflation Report, Greed Index Remains in Fear Zone, News, 15 July 2026
- Oil Is Up After the Strait of Hormuz Closed Again, News, 15 July 2026
- Inside Active, Invesco's Burrello on Option Income Trade-Offs, BI Transcript, 13 July 2026
- The Global Volatility Pulse, KOSPI Tops Charts, Research, 12 May 2026
- Tactical Trading Drives Leveraged ETF Option Boom, Research, 14 July 2026
- US Equity Derivatives Strategy, Buffering: Are Defined Outcome ETFs Reshaping Vol, Research, 13 May 2026
- Why a Hidden Divergence Between the VIX and Nasdaq Volatility Has the Smart Money on Edge, News, 9 July 2026
- S and P 500 Calm Masks Turbulent Single-Stock Volatility in Tech, News, 14 July 2026
- Hedging Is Disappearing, It Is a Huge Market Risk, News, 8 July 2026