Same Symptoms, Different Disease: why 2026 is not a rerun of 2022
Everyone on the tape is reaching for the 2022 analogy. Inflation is re-accelerating, the long end is heavy, debt is at a record and oil is bid. The reflex is to pull up the 2022 playbook and brace for another 25 percent drawdown. I think that is the wrong map. The symptoms rhyme, but the disease is different, and the treatment that worked last time is no longer available.
I have spent this week going gauge by gauge through the comparison, because the analogy is doing a lot of unexamined work in people's heads right now. The honest conclusion is that 2026 shares almost every surface reading with 2022 and almost none of its mechanics. That gap matters, because it changes both the probability and the shape of what comes next. Let me walk through it the way I would on the desk: what is the same, what is different, what the market has already decided, and where the real fault line sits.
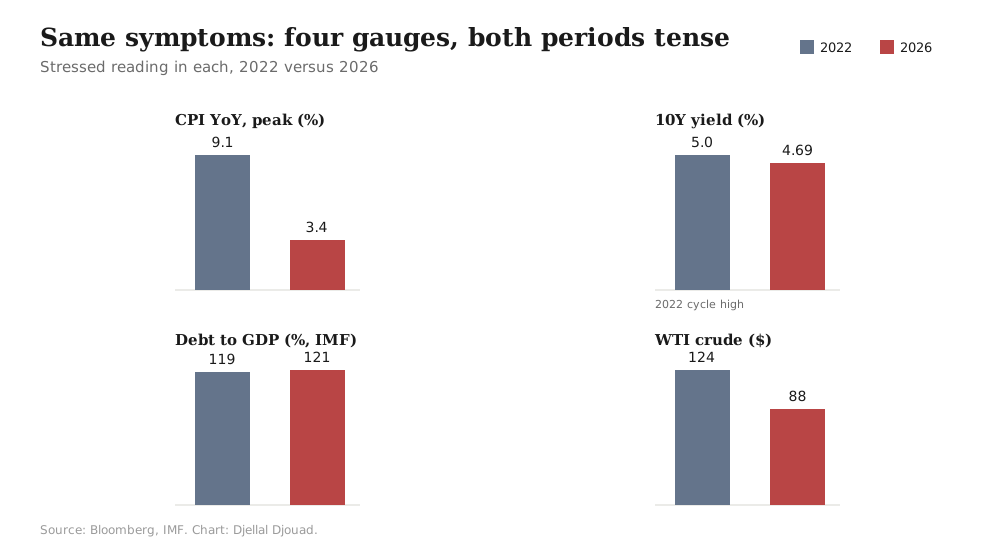
1. Same symptoms
Start with the four dials that anchor the analogy, because on levels the bears have a point.
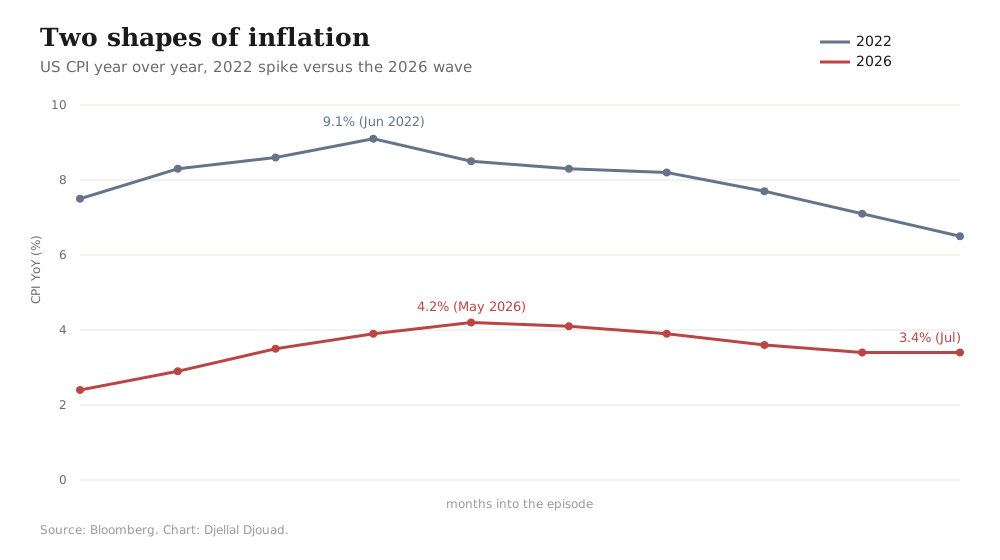
Inflation. The 2022 shock was severe and fast, peaking at 9.1 percent in June 2022 on energy and supply chains. It then fell steadily, bottoming near 2.3 percent in April 2025, and has since turned back up to 3.4 percent in July 2026. That is a meaningful move higher, even if it is nowhere near the old peak.
Rates. In early 2022 the 10-year started near 1.6 percent and surged to almost 5.0 percent by October 2023 as the Fed hiked. Today it sits around 4.69 percent, still elevated and close to the cycle highs. The distinction I keep coming back to is this: in 2022 the direction of travel was the shock. Today the level itself is the burden.
Debt. Federal debt-to-GDP has been structurally elevated throughout. IMF actuals show it rising from 118.8 percent in 2022 to 120.8 percent in 2024. Bloomberg's own series prints lower, around 100 to 102 percent for 2025 and 2026, a methodology difference rather than a contradiction. Both agree on the direction: high and rising.
Oil. This is where the surface begins to crack. In 2022 WTI spiked to 123.70 dollars in March, a pure geopolitical supply shock. Today it trades near 88 dollars, elevated versus the 2025 lows around 55 but without the acute disruption dynamic.
Put the two columns side by side and the resemblance is real.
| Factor | 2022 (post-invasion) | Today (Aug 2026) |
|---|---|---|
| CPI year-over-year | 7 to 9 percent, surging | around 3.4 percent, re-accelerating |
| 10-year Treasury yield | 1.6 percent, rising fast | around 4.69 percent, already elevated |
| Debt to GDP | around 119 percent | around 121 percent (IMF) or 102 percent (Bloomberg) |
| WTI crude | 76 to 124 dollars, acute spike | around 88 dollars, gradual recovery from lows |
| Inflation driver | energy and supply shock, exogenous | tariffs, fiscal and demand, structural |
| Rate trajectory | hiking cycle just beginning | rates already high, limited room |
2. Different disease
Now look at the last two rows, because that is where the analogy dies. In 2022 the inflation impulse was exogenous. A war spiked energy, supply chains seized, and the price level jumped through channels outside the financial system. The Fed was starting from near zero, so it could respond with the most aggressive hiking cycle in decades, and that response, not the war, is what mechanically crushed equity valuations by expanding the discount rate.
Today the impulse is endogenous and gradual. It is tariffs, fiscal dynamics and demand, not a physical supply seizure. And crucially, the starting point of rates is inverted. The Fed is not pivoting from zero, it is already at a restrictive level with very little room and, the market suspects, limited willingness to re-accelerate tightening. The 2026 CPI path tells that story precisely: it troughed near 2.4 percent in February, peaked at 4.2 percent in May, and has since eased back to 3.4 percent in July. The re-acceleration already has a rollover in it.
3. The market has already voted
If you want to know whether the market buys the 2022 analogy, look at what it did with equities, because the verdict is not subtle.
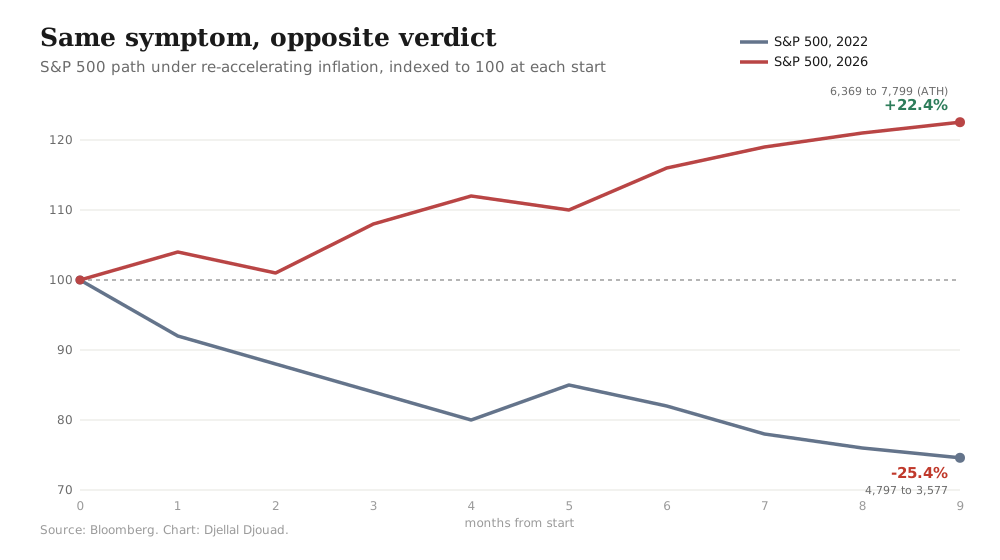
In 2022 the S&P 500 entered the year at 4,797 and fell to a trough of 3,577 on 12 October, a peak-to-trough decline of 25.4 percent over roughly nine months. There was no shelter. Growth and value sold off together, and there was no meaningful counter-rally until the fourth quarter. Multiple compression did the damage, and it did it to everything at once.
In 2026 the same nominal symptom, re-accelerating inflation, produced the opposite tape. From a local low of 6,369 on 27 March, the index rallied to an all-time high of 7,799 on 13 August, a gain of 22.4 percent over about five months, even as CPI was climbing to its May peak. This is not a market compressing multiples into a rate shock. It is a market letting earnings momentum dominate the inflation narrative, because it has decided the Fed has neither the room nor the appetite for a new hiking cycle.
| Factor | 2022 drawdown | 2026 re-acceleration |
|---|---|---|
| CPI at start | around 7 percent, surging | around 2.4 percent, re-accelerating |
| CPI peak | 9.1 percent (Jun 2022) | 4.2 percent (May 2026) |
| S&P direction | minus 25.4 percent (Jan to Oct) | plus 22.4 percent (Mar to Aug) |
| Market regime | multiple compression | earnings-driven expansion |
| Investor reaction | risk-off, broad selloff | risk-on, rally to highs |
4. Why so calm? The amplifiers are switched off
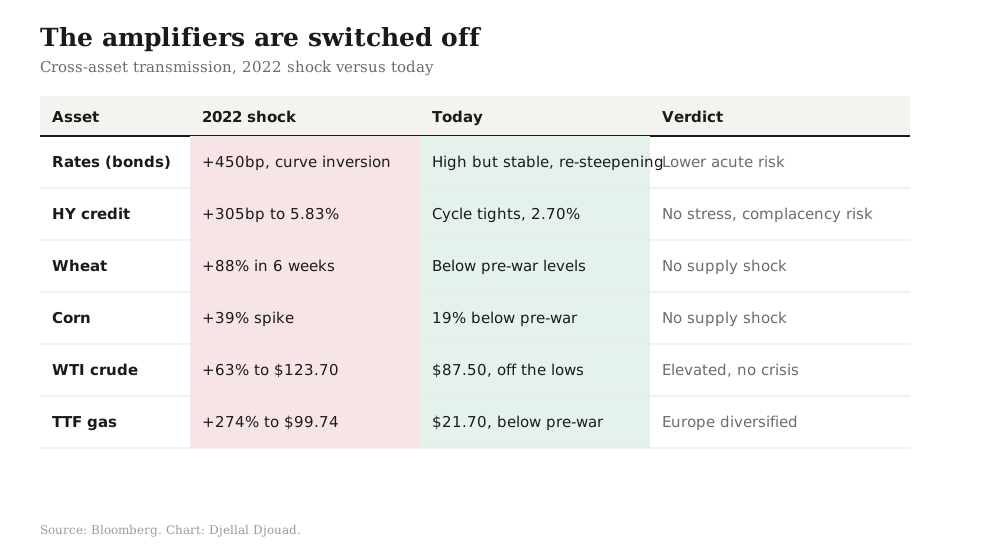
The reason equities can shrug this off is that the channels that amplified the 2022 stress are not transmitting today. In 2022 the shock did not stay in one market. It propagated. Rates surged 450 basis points and the curve inverted. High-yield spreads blew out by 305 basis points to 5.83 percent. Wheat spiked 88 percent in six weeks, corn 39 percent, WTI 63 percent to that 123.70 print, and European TTF gas an astonishing 274 percent to 99.74. Every one of those was a live wire carrying the shock into the real economy and into credit.
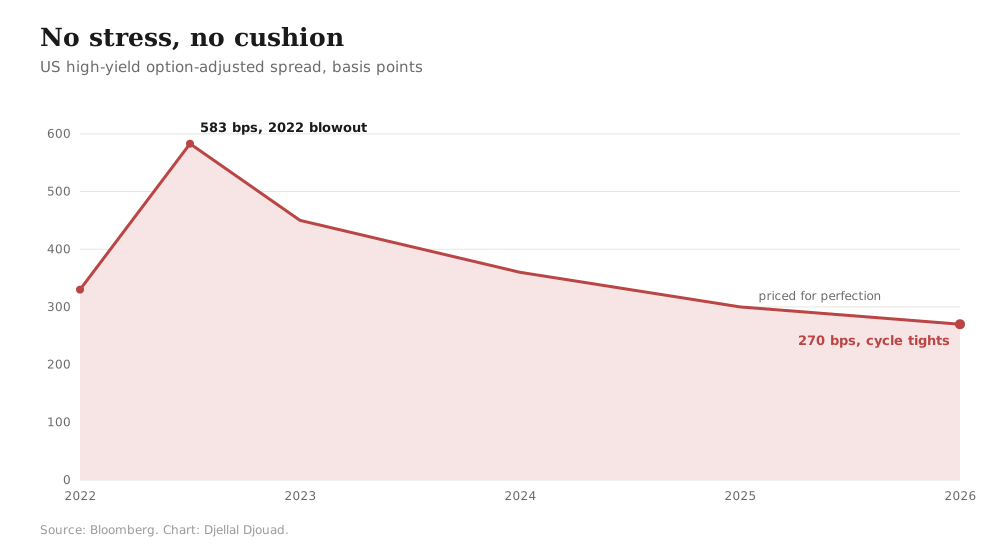
Run the same instruments today and the wires are dead. Yields are high but stable, and the curve is re-steepening rather than inverting. Wheat and corn are below their pre-war levels, corn actually 19 percent below. TTF gas is at 21.70, below pre-war, because Europe diversified its supply. And high-yield spreads are not blowing out, they are pinned at cycle tights around 2.70 percent.
Here is where I part company with the comfortable read. That 2.70 percent high-yield spread is not proof of health. It is complacency, and complacency is fuel, not a firebreak. Credit priced for perfection has no cushion. If a shock does arrive, the repricing starts from the tights and travels a long way. The same is true of the rates picture: no velocity shock, but a higher carry burden that accumulates silently every month the level stays where it is.
5. The real fault line: AI capex financed by debt
If the 2022 threat was a war, the 2026 threat is a building boom. The concern is well founded and increasingly mainstream, and it has grown large enough to open genuine macro transmission channels of its own.
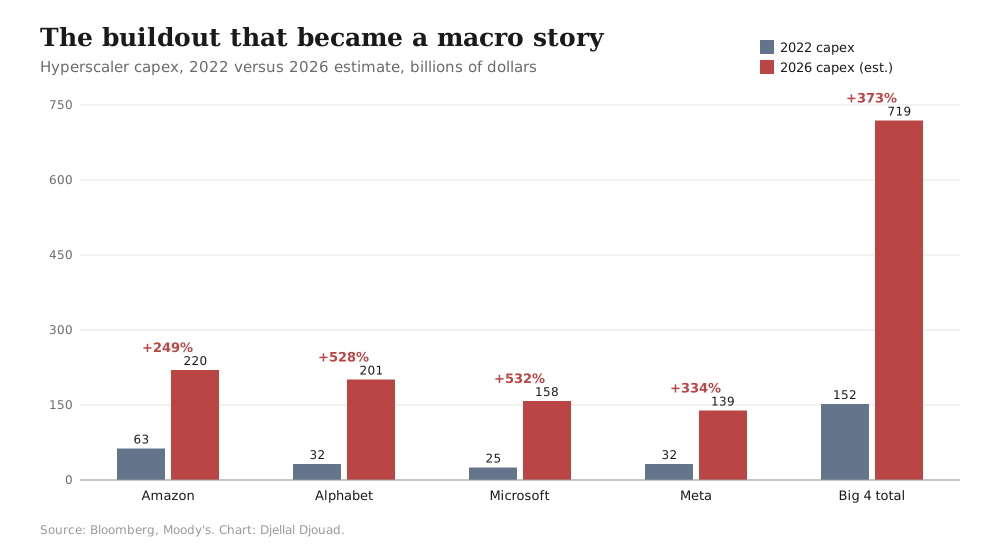
The scale is the starting point. The big four hyperscalers, Amazon, Alphabet, Microsoft and Meta, are on track to spend a combined 719 billion dollars of capex in 2026. Moody's estimates the six largest US hyperscalers could reach 785 billion in 2026 and approach one trillion in 2027. Against 2022, that is a 373 percent increase in four years. Apollo's Torsten Slok has noted that data-center investment is building at close to twice the pace of the mid-2000s housing boom, and has called it a severe macroeconomic threat if AI demand falters.
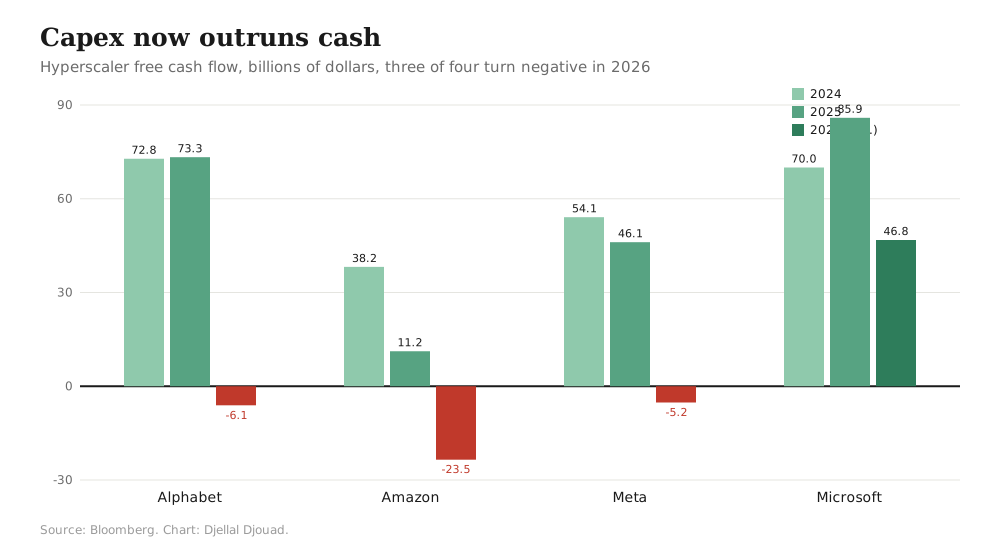
The structural change that actually matters is this: for the first time in the cycle, capex is now outrunning cash generation. Three of the four hyperscalers are expected to print negative free cash flow in 2026. Alphabet swings from 73.3 billion in 2025 to minus 6.1 billion, Amazon from 11.2 billion to minus 23.5 billion, Meta from 46.1 billion to minus 5.2 billion. Only Microsoft stays positive. The gap is being filled with debt. According to the Wall Street Journal, nearly 160 billion of the 850 billion in hyperscaler and neocloud capex in 2026 will be funded by new borrowing. JPMorgan lifted its 2026 tech bond issuance forecast to 540 billion from 450 billion. Hyperscaler supply has already made up close to a quarter of year-to-date US investment-grade issuance, and on 19 August Alphabet raised 3.89 billion dollars in its first-ever Australian dollar bond sale, a sign of how far these names are now reaching for funding.
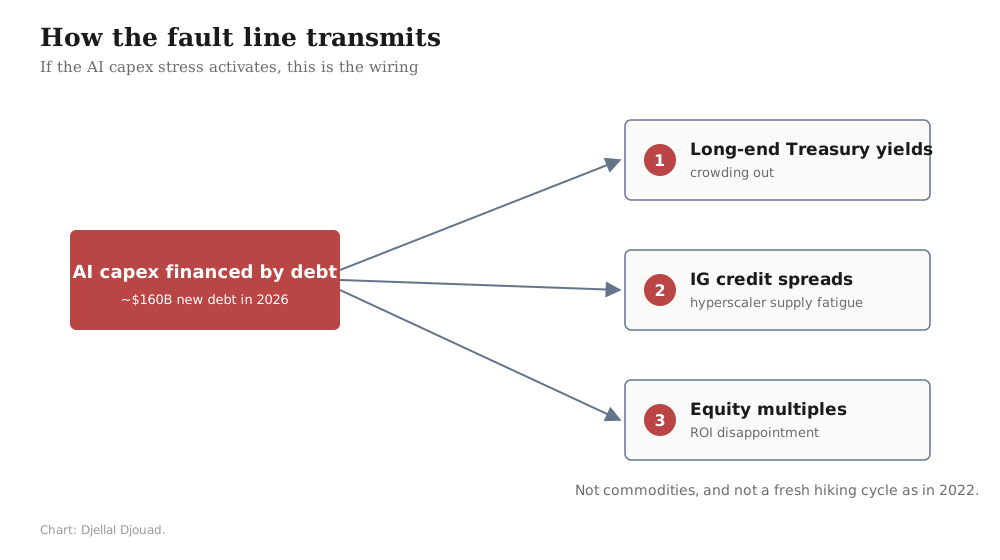
Once the buildout is funded by bonds, it stops being a technology story and becomes a rates story. I read this as related to the pattern I laid out earlier in the AI debt Trojan inside the IG index and in the AI infrastructure financing loop. There are three channels through which it transmits.
One, crowding out. Heavy corporate borrowing to fund data centers, layered on top of already substantial government supply, competes with Treasuries for a finite pool of investor demand and pushes real yields higher. If a large share of AI investment is financed through investment-grade issuance, the crowding-out effect on the long end is direct, and it arrives without the Fed lifting a finger. Increased Treasury reliance on coupon issuance into that same demand could strain liquidity at the very long end if buy-and-hold buyers do not absorb the flow.
Two, credit spread stress. Hyperscaler credit curves already trade steeper than other multi-tranche IG issuers. The desk view I find persuasive projects another 10 to 15 basis points of back-end underperformance on hyperscaler spreads over a six-month horizon, driven by recurring upside surprises to capex and by uncertainty on when the return on investment actually shows up. A sharp de-rating of the AI equity leaders would feed straight back into perceived credit quality, and total returns suffer most if an equity drawdown coincides with wider funding spreads or a stall in primary issuance.
Three, a demand shock in reverse. If AI adoption slows or fails to deliver measurable returns, all that debt-funded capital comes under scrutiny at once, and sentiment across the technology ecosystem can correct sharply. Apollo expects private credit to carry more of the financing, with total requirements potentially reaching two trillion dollars, an amount that could test the capacity of public debt markets. We already have an early company-level signal: Oracle reportedly planned thousands of job cuts in March 2026 to manage a cash crunch from its data-center expansion. That is what capex overreach looks like before it becomes a market event.
6. What the market thinks, and the two-sided case
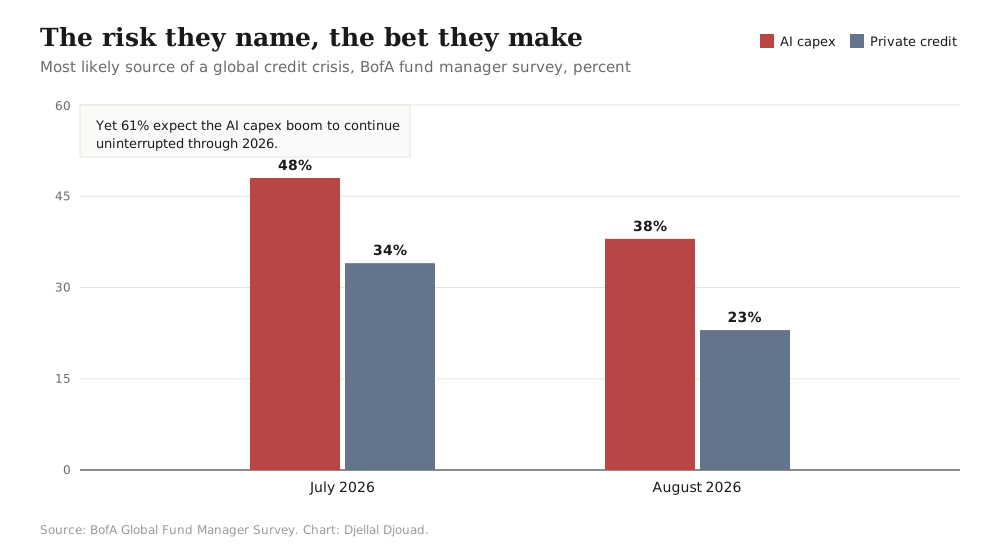
The market is not blind to this. The Bank of America Global Fund Manager Survey in July 2026 found 48 percent of managers naming hyperscaler AI capex as the most likely source of a global credit crisis, ranking it above private credit at 34 percent. The August survey had it at 38 percent, with private credit second at 23 percent, still the single largest identified systemic risk. And yet, in the same July survey, 61 percent expected the AI capex boom to continue uninterrupted through 2026 and only 28 percent expected the hyperscalers to cut spending. Read those two facts together. The market has named its number-one systemic risk and is simultaneously betting it will not detonate this year. That is complacency measured in real time.
I try to keep myself honest by writing both sides down. Here is the bull and bear case as I hold it.
| Bull case (orderly) | Bear case (stress) |
|---|---|
| Balance sheets still strong, Alphabet net cash 74 billion | Three of four now free-cash-flow negative in 2026 |
| Cloud revenue and RPO backlogs remain robust | More than 160 billion of 2026 capex funded by new debt |
| AI productivity supports higher real yields without recession | Crowding out competes with Treasuries, lifts long yields |
| Data-center pre-leasing above 70 percent, vacancy near 2 percent | Build pace is twice the mid-2000s housing bubble |
| IMF raised 2026 global growth to 3.3 percent citing AI | ROI timing uncertain, credit markets want clarity |
7. The postponement risk
So where does that leave me. The structural parallel with 2022, elevated debt, sticky inflation, high rates, is real, and I do not want to wave it away. But the mechanism is different in a way that changes the trade. In 2022 the shock was exogenous and the Fed had ammunition. In 2026 the pressure is endogenous, the multiples are already stretched to record highs, and the policy cushion is close to gone.
The mistake would be to read the current calm as an all-clear. My base case is not that the shock has been avoided. It is that it may have been postponed. The amplifiers are switched off for now, but the fuse, debt-funded AI capex feeding into long-end yields and a credit market with no cushion, is being laid in plain sight. If the shock does come, it will not look like 2022. It will not arrive through commodity prices or a fresh hiking cycle. It will run through long-end Treasury yields on crowding out, through investment-grade spreads on hyperscaler supply fatigue, and through equity multiples on ROI disappointment. And it would hit a market carrying far less cushion than it had in 2022.
The one variable I am watching above all others is the inflation path itself. CPI has already rolled from its 4.2 percent May peak back to 3.4 percent. If that easing continues, the market's bet that the Fed can stay on hold looks right and the rally has a foundation. If it reverses, the postponed shock starts to arm, and it arms into a credit market priced for perfection. Same symptoms as 2022, different disease, and a treatment that is no longer in the cabinet.
These are notes from my own desk, not investment advice. Figures are drawn from Bloomberg data and research as of 20 August 2026. Related reading: the AI debt Trojan inside the IG index, the coming crash and its four convergent faults, and the AI infrastructure financing loop.
Sources
- Charlie Lay, Commerzbank, "Asia Daily Update: Chips slide, Hormuz standoff lingers", Research, 19 August 2026 (Bloomberg Terminal).
- Torsten Slok, Apollo, "AI Capex Boom Is Growing Nearly Twice as Fast as the Mid-2000s Housing Bubble", Bloomberg News, 7 August 2026.
- "The Massive Debt Explosion Behind the AI Buildout", The Wall Street Journal via Bloomberg, 25 June 2026.
- "JPMorgan Boosts Tech Bond Sales Outlook as AI Debt Binge Expands", Bloomberg News, 7 August 2026.
- Grace Wang, UBS, "World at a Glance" (Kapteyn), Global Economics and Strategy, 5 May 2026 (Bloomberg Terminal).
- "Alphabet Raises 3.9 Billion in First Australian Bond Sale as AI Spending Surges", Bloomberg News, 19 August 2026.
- Charlie Lay, Commerzbank, "Asia Daily Update", Research, 19 August 2026 (Bloomberg Terminal).
- Benito Berber, "Americas Share Inflation Pain", Research, 15 May 2026 (Bloomberg Terminal).
- Mapfre Economics, "2026 Economic and Industry Outlook", Research, 24 March 2026 (Bloomberg Terminal).
- Julien Conzano, "AI Debt Boom: cracks emerge, but the cycle extends", Global Strategy, 1 August 2026 (Bloomberg Terminal).
- Charlie Lay, Commerzbank, "Asia Daily Update", Research, 19 August 2026 (Bloomberg Terminal).
- Jack Leung, "U.S. Convertibles Outlook 2026: Positioning for a 1-0 Win", Research, 19 December 2025 (Bloomberg Terminal).
- Shubham Dalia, "Information Technology Sector Thematic: Cornered on 2 fronts", Research, 8 April 2026 (Bloomberg Terminal).
- "Apollo Sees 1 Trillion Private Credit Opportunity for Financing AI Build-Out", Bloomberg News, 10 August 2026.
- "Oracle Plans Thousands of Job Cuts in Face of AI Cash Crunch", Bloomberg News, 5 March 2026.
- "AI Capital Expenditure Most Likely Source of Credit Crisis: BofA Survey", Bloomberg News Market Talk, 15 July 2026.
- "AI Capital Expenditure Seen as Most Likely Source of Credit Crisis", Bloomberg News Market Talk, 18 August 2026.
- "Majority of Investors Expect No Cuts to AI Capital Expenditure: BofA Survey", Bloomberg News Market Talk, 15 July 2026.
- "IMF Raises 2026 Global Economic Growth Outlook Amid AI Investment Boom", Bloomberg News, 20 January 2026.
- Julien Conzano, "AI Debt Boom: cracks emerge, but the cycle extends", Global Strategy, 1 August 2026 (Bloomberg Terminal).