The Treasury Basis Trade: Mechanics, Current Stress, and the Shared Tail
As of September 19, 2026. A desk-level walk through the cash-futures, repo, curve, and inter-tenor structures that populate the leveraged Treasury complex, the point-value mechanics that decide who survives a selloff, and the correlation-to-one failure that ties the basis book to the dispersion book.
1. Short answer: is there blow-up risk soon?
The honest read is that blow-up risk is elevated and building, but the shape of the risk matters more than the level. This is not set up to be a single-day detonation in the style of the August 2024 yen-carry unwind. It is set up to be a progressive squeeze, a slow tightening of three separate vises at the same time, with a well-defined catalyst window sitting directly ahead: next week's $173bn auction series across Tuesday, Wednesday, and Thursday, a dense calendar of Fed speakers, and a policy summit that markets are treating as binary.
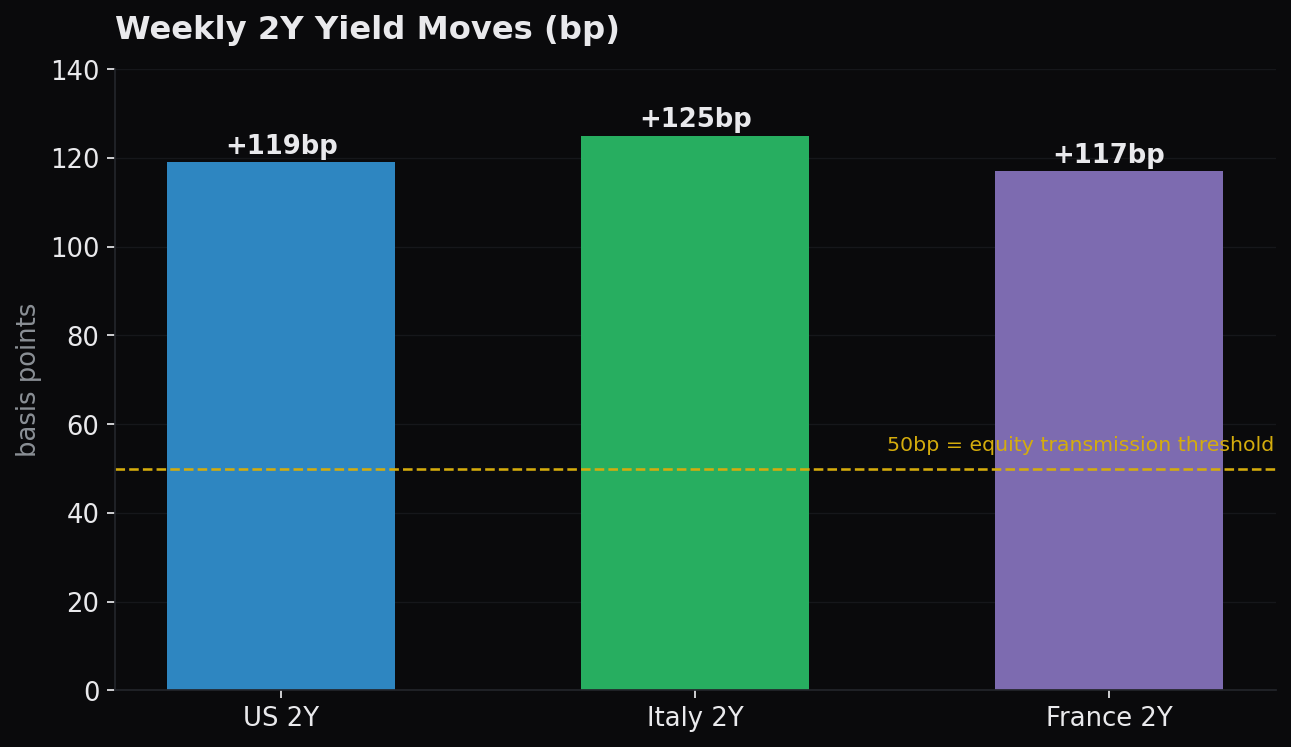
The distinguishing feature of the current regime is that the leveraged long-Treasury complex is losing on three fronts simultaneously. It is losing carry, because forward bases have gone negative and the position now pays to be held rather than paying you to hold it. It is losing mark to market, because the 10Y has pushed to 5.00 to 5.04 percent, a level last seen at the 2007 and 2008 highs, and the front end has moved even more violently, with the US 2Y up 119bp on the week. And it is losing liquidity, because top-of-book depth has thinned to roughly $1mm, the lowest on the series, while ETFs now account for 29 percent of the tape and the first fixed-income outflows in 24 weeks have begun. Any one of those three is survivable. The problem is that they are arriving together, and each one amplifies the other two.
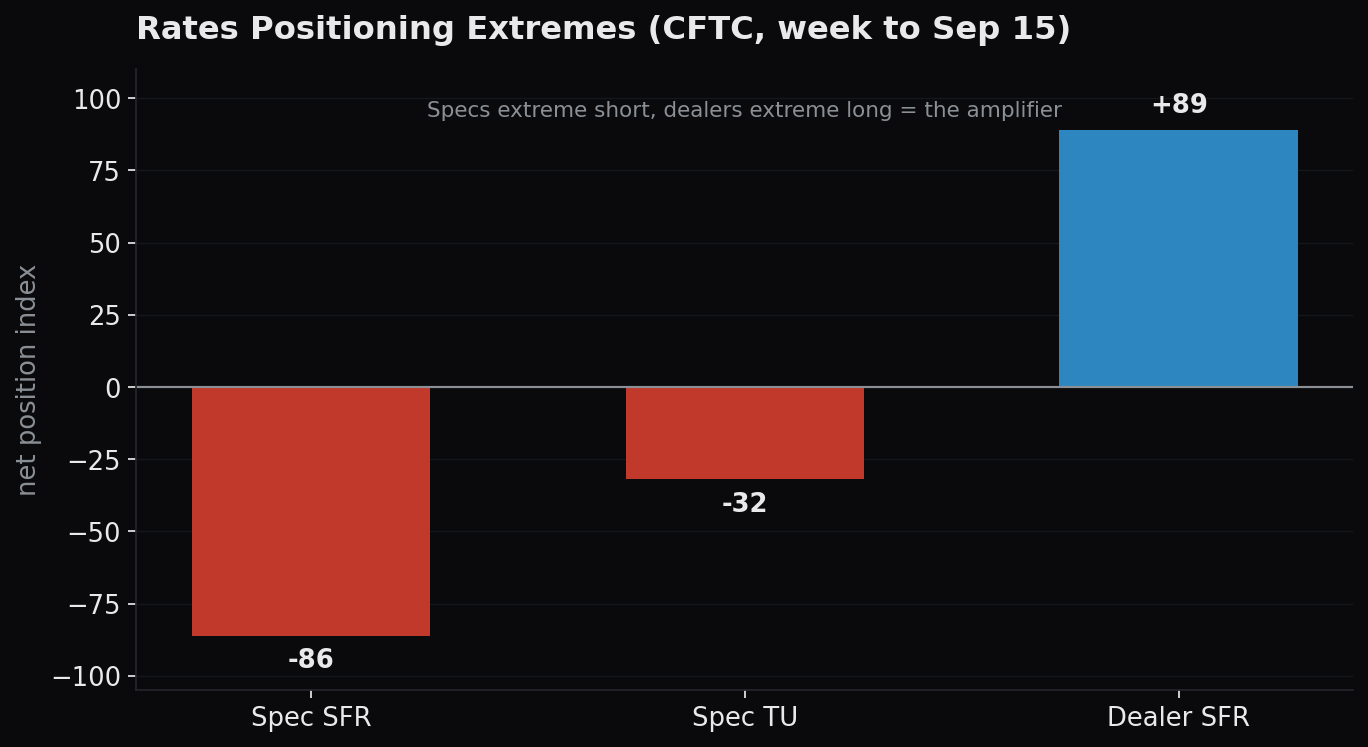
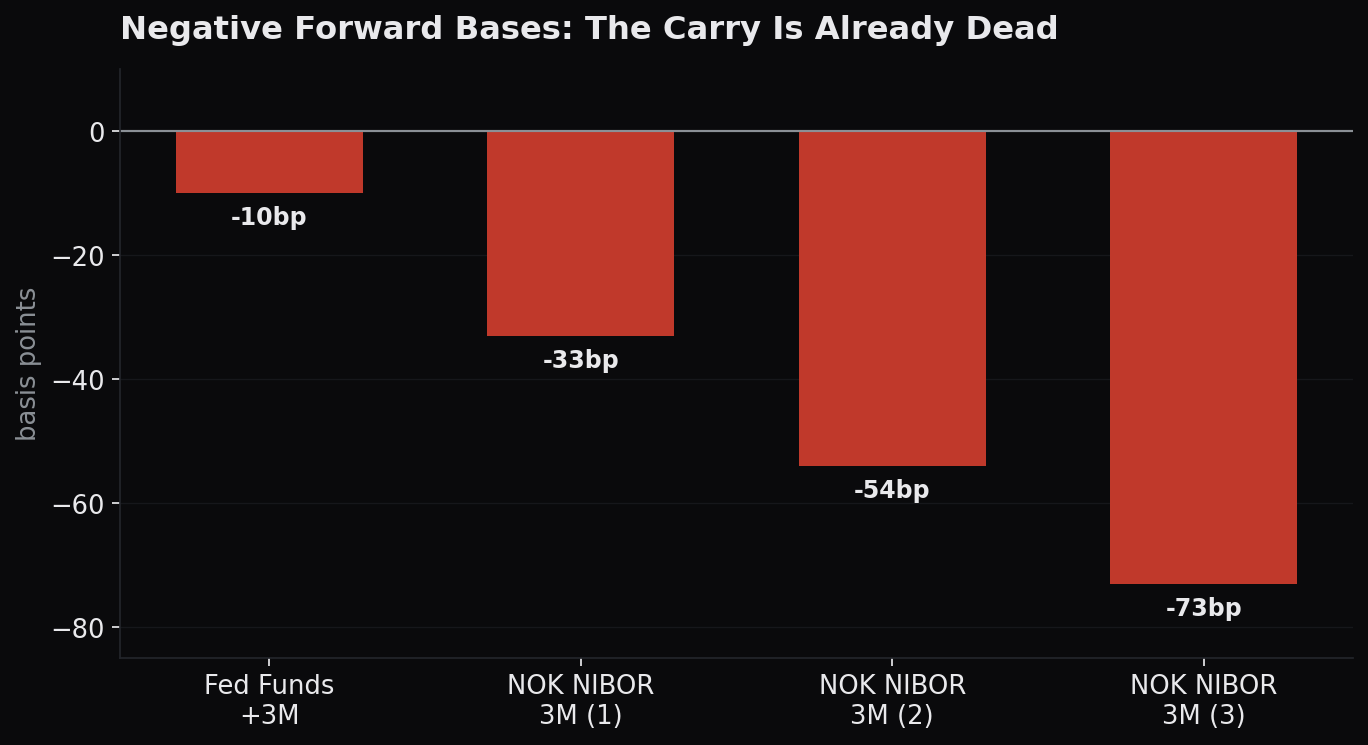
The ingredients, laid out plainly, describe a fuel load rather than a fire. The 10Y sits at 5.00 to 5.04 percent against the old cycle high; the 2Y at 4.73 to 4.74 percent after a weekly move of plus 119bp in the US, plus 125bp in Italy, and plus 117bp in France, a globally synchronized front-end repricing. The curve is nearly flat: 10Y minus 2Y is roughly 27bp (5.00 less 4.73), the lowest since March 2025, while the 2s30s stands at 62bp. Forward bases have inverted, with Fed Funds plus 3M at minus 10bp and NOK NIBOR 3M running at minus 33, minus 54, and minus 73bp across the strip. Positioning is stretched at both poles: CFTC data show specs net short 86,000 SOFR contracts and net short 32,000 in the 2Y (TU), while dealers sit net long 89,000 SOFR. Supply is relentless: the $173bn calendar next week, Treasury now 46 percent of total US debt issuance versus 15 to 20 percent across 2005 to 2010, roughly $1T of net corporate supply in 2026, $420B of hyperscaler investment-grade issuance projected for 2027, and $260bn of net tech issuance in 2026. The marginal buyer is missing: foreign holdings have slipped to about 30 percent, near the 29 percent low of 2023. Rates volatility is running above 75 to 80bp, and the equity-bond correlation has climbed to plus 0.61 and is still rising, which means the bond leg is no longer hedging anything.
Put together, this is a fragile equilibrium, not a crisis in progress. The net basis on the front 10Y contract is 0.7144 in 32nds, orderly rather than dislocated, and open interest of 40,668 is nowhere near a pre-2020 extreme. The trade has not broken. But it is being asked to survive a triple squeeze into the single worst supply and headline window of the quarter, and the mechanics below explain exactly how that survival gets tested.
2. How bond basis trades work: mechanics, structure by structure
The leveraged Treasury complex is not one trade. It is a family of relative-value structures that all monetize a small, supposedly convergent spread with large amounts of borrowed money. The four that matter here are the cash-futures basis, the repo or funding basis, the curve basis, and the inter-tenor or breakeven basis. Each has its own point-value signature, and each fails in its own way.
A. Cash-futures basis
The canonical structure is long the cash Treasury and short the futures contract, sized so that the two legs offset in duration. The hedge ratio is one divided by the product of the conversion factor and the DV01 ratio between the deliverable and the notional. The trade earns the basis, defined as the cash price less the futures price scaled by the conversion factor, and that basis is expected to converge to zero at delivery, adjusted for financing carry along the way.
Take the specific live contract. TYU6, the September 2026 10Y note future, trades at 106-02.5, which is 106 plus 2.5 over 32, or 106.0781 in decimal. The cheapest-to-deliver into that contract is the Treasury 4.25 percent of 05/31/33. The net basis of that CTD is 0.7144 in 32nds. The point value is fixed by the contract specification: face is $100,000, one full point is worth $1,000, and one 32nd is worth $31.25. A net basis of 0.7144 32nds is therefore worth 0.7144 times $31.25, or about $22.33 per contract on a gross basis. With open interest of 40,668 contracts, this is a large, liquid, and normally uneventful spread.
The signal that turns an uneventful spread into a stressed one lives in the financing. The implied repo rate on this contract is 2.9682 percent. The actual general-collateral repo rate is 3.8837 percent, with SOFR at 3.85 and GC at 3.88 percent. The implied repo is therefore 91.5bp below the actual repo (3.8837 less 2.9682 equals 0.9155). That gap is the whole story. Implied repo is the return the market is willing to accept for owning the cash bond and shorting the future into delivery. When implied repo sits 91.5bp below the rate you actually pay to finance the cash bond in the repo market, the position carries negatively: you are financing at 3.88 percent to earn an implied 2.97 percent. The future is cheap relative to cash, and holding the arbitrage costs you 91.5bp of carry per year for the privilege of waiting for a convergence that the calendar does not guarantee.
Leverage turns that carry into a live wire. At 50x leverage, built on a haircut of roughly 1 to 2 percent, the desk rule of thumb for this contract is that 1bp of yield movement is worth roughly $500 of profit and loss per $1M of face. That sensitivity is what makes a 20bp intraday range, unremarkable in the current tape, a material event on levered capital.
The point-value table below scales the structure to a $100m notional cash position with a duration near 8.2, the reference book the desk uses to stress the hedge. Read the residual column, not the gross legs: the residual is the basis risk that the hedge is supposed to neutralize and does not.
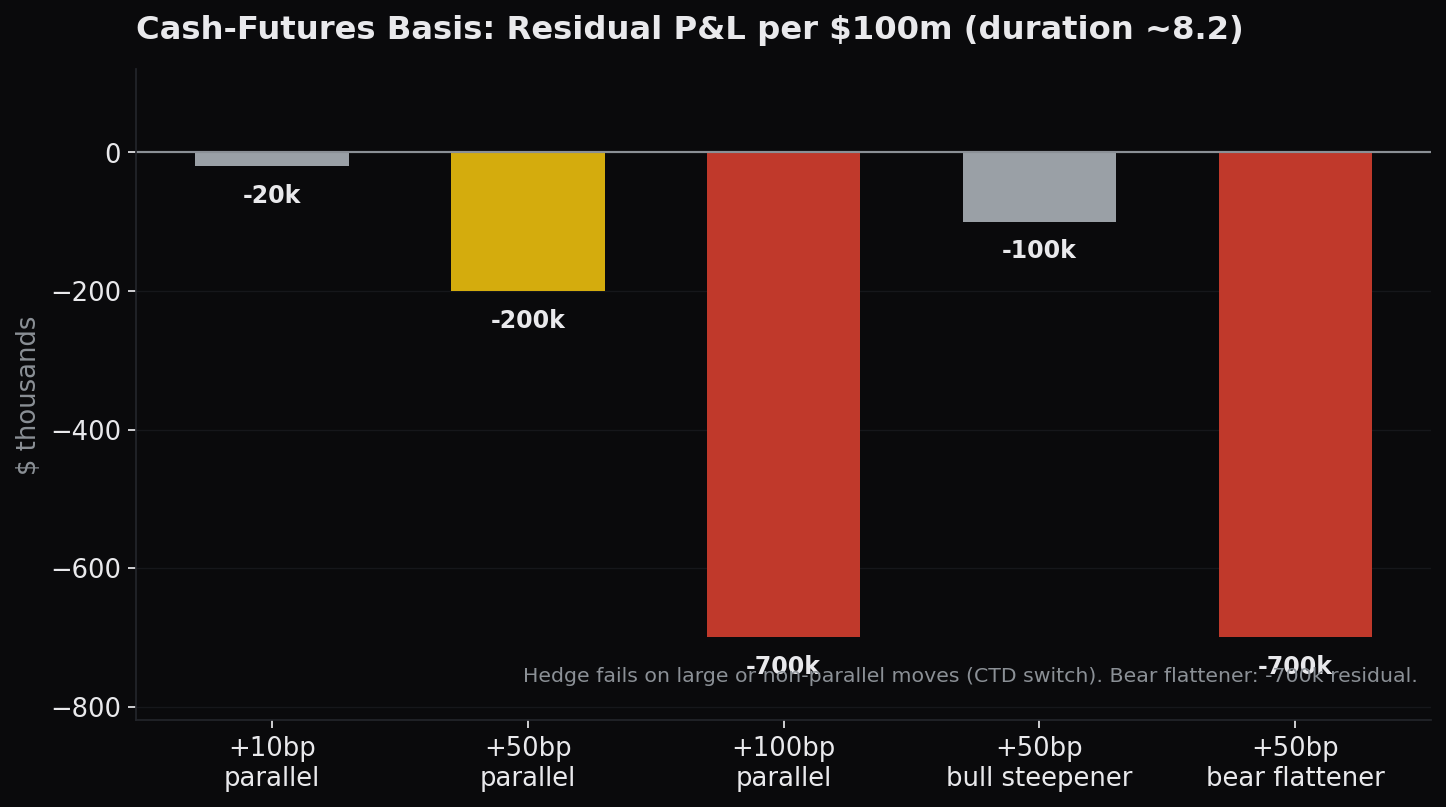
| Scenario | Cash bond leg | Futures leg | Residual (basis P&L) |
|---|---|---|---|
| +10bp parallel | -820k | +800k | -20k |
| +50bp parallel | -4.1m | +3.9m | -200k |
| +100bp parallel | -8.2m | +7.5m | -700k |
| +50bp bull steepener | -1.6m | +1.5m | -100k |
| +50bp bear flattener (2Y +20, 10Y +30) | -2.5m | +1.8m | -700k |
Three features of this table are the entire risk. First, the hedge is good, not perfect. On a clean 10bp parallel move the residual is only minus $20k on minus $820k of gross exposure, roughly 97.6 percent hedged. Second, the residual grows faster than linearly. Doubling the shock from 50bp to 100bp does not double the residual from minus $200k to minus $400k; it more than triples it to minus $700k, because convexity and the optionality embedded in which bond is cheapest to deliver both work against the hedger. Third, and most important, the hedge fails outright when the curve moves against it. The bear flattener case, where the 2Y rises 20bp and the 10Y rises 30bp, produces a minus $700k residual on a smaller headline shock than the parallel 100bp case, because the deliverable basket shifts and the hedge ratio that was correct at inception is now wrong. This is the CTD-switch risk, and it is precisely the scenario that the current front-end-led selloff, plus 119bp on the 2Y in a week, is manufacturing.
B. Repo or funding basis
The second structure strips out the futures leg and expresses the trade directly: buy the bond, finance it in repo, and earn the spread between the bond yield and the repo rate. The daily profit and loss is the carry, which is the yield minus the repo rate accrued on the notional, plus the change in the bond's price, minus any margin call. In calm markets the carry term dominates and the position grinds out income. In a selloff the price term and the margin term dominate and the carry becomes an afterthought.
The arithmetic is unforgiving, so it is worth doing in full. Take $100m of the 10Y at 5.00 percent, financed in repo at SOFR plus 15bp, which is 4.15 percent. The net carry spread is 85bp. On $100m that is $850,000 per year, or, on an actual/360 basis, roughly $2,361 per day. That is the entire reward for holding the position: a little over two thousand dollars a day.
Now let the 10Y sell off 50bp in a single session, from 5.00 to 5.50 percent. On a duration near 8.2 the mark to market on the bond is about minus $4.1m, consistent with the parallel case in the table above. The prime broker's margin requirement of 5 percent implies $5m of posted collateral against the position. After the move, the position is under-collateralized by roughly $4.1m, the amount of the loss. The desk has three options, and only three: post cash it may not have, sell the bond into a falling market, or default. The kill mechanic is now visible in a single ratio. The single-session margin call of about $4.1m is on the order of 1,700 times the daily carry of roughly $2,361. You cannot carry your way through a margin call of that magnitude. No plausible accumulation of 85bp-a-year income offsets a loss that arrives in an afternoon and demands cash by the close. And the 50bp daily move that triggers it is not a tail assumption this week; it is roughly what the 2Y has been doing, with plus 119bp banked over five sessions. When the funding leg and the price leg turn together, the repo basis does not bleed. It gets liquidated.
C. Curve basis
The third structure trades the shape of the curve rather than its level. The classic expression is a 2s10s flattener: long the 2Y future, short the 10Y future, sized DV01-neutral so that a parallel shift nets to roughly zero and the position profits only if the curve flattens. With 10Y minus 2Y at roughly 27bp and 2s30s at 62bp, the curve is already compressed, which is exactly the condition under which flatteners look attractive and behave dangerously.
The problem is that the two forces acting on the curve are pulling in opposite directions and both are live. A hiking or hawkish Fed lifts the front end, which helps the flattener. But fiscal and AI-driven supply concentrates in the back end, which lifts long yields and hurts the flattener. The question of who wins when both ends rise is decided by which end rises more. If the 10Y moves from 5.00 to 5.50 while the 2Y moves from 4.73 to 5.00, the curve steepens by 23bp even though both yields rose, and the flattener loses on a selloff it was supposed to be neutral to. The back-end supply overhang, $173bn of auctions next week concentrated in the very tenors the flattener is short, is a structural steepening pressure, and steepening is the flattener's loss condition. A curve trade that looks like a hedged, low-variance carry position is in fact a short position in exactly the supply risk that dominates the current calendar.
D. Inter-tenor and TIPS breakeven
The fourth structure trades across the nominal and real curves. Long a nominal 10Y and short the matched-maturity TIPS is a short breakeven position; long nominal and short TIPS to earn the breakeven, currently in the 2.3 to 2.5 percent area, is the more common carry expression. The position earns the breakeven and is exposed to an inflation surprise. If oil pushes back above $100 and breakevens widen, the short TIPS leg loses, and it loses from a starting point where breakevens already sit above their longer-run average, meaning the cushion is thin. Like the other three structures, this one is being paid to take a risk that the current macro backdrop, sticky inflation and a supply-heavy curve, is actively trying to realize.
3. Where is the main risk, ranked
Not all of these exposures are equally dangerous right now. Ranked by how close each is to being the trigger, the order is clear.
Number one: dealer positioning plus thin liquidity, the amplifier. This is the rates equivalent of equity dealer gamma, and it is the single most important structural fact in the market this week. Specs are extreme short, with SFR at minus 86 and TU at minus 32. Dealers are the counterparty, extreme long, with SFR at plus 89. A dealer community that is long the front end into a rising-yield tape is effectively short convexity: as yields rise, dealers lose mark to market and must hedge by selling more futures, which pushes yields higher still, which margin-calls the spec shorts into covering, which provides a burst of temporary support before the subsequent de-risking removes it. Every one of those steps runs through a top-of-book that is roughly $1mm deep. When the book is that thin, the basis does not widen by a few basis points in an orderly fashion. It gaps, and a spread that was 5bp becomes 50 to 100bp in minutes because there is no depth to absorb the flow. The positioning is the fuel; the thin book is the accelerant.
Number two: structural supply and the missing buyer. Treasury issuance is now 46 percent of total US debt versus 15 to 20 percent in the 2005 to 2010 period, and the marginal buyer has stepped back, with foreign holdings near 30 percent against the 29 percent low of 2023 and net TIC flows from China and the rest of the world negative. Layer on $173bn of auctions next week, roughly $1T of net corporate supply in 2026, $420B of hyperscaler investment-grade issuance in 2027, and $260bn of net tech issuance in 2026, and the picture is of a market being asked to absorb more paper than its buyer base wants. For the basis trade this is existential in a quiet way: the convergence the trade is waiting for may simply never arrive on the expected schedule, and in the meantime the position pays negative carry while the underlying asset depreciates.
Number three: the equity-bond correlation break. The cross-asset correlation has risen to plus 0.61 and has been climbing since 2022, when it should be negative. The consequence is direct and brutal: when stocks fall, bonds now fall with them, because both are responding to the same rate shock. The bond leg is no longer a diversifier. It has become a second, correlated exposure, which means a book that believed it was long rates and long equities with an offsetting hedge is in fact double-long the same risk factor.
Number four: negative forward bases. With Fed Funds plus 3M at minus 10bp and NOK NIBOR 3M at minus 33, minus 54, and minus 73bp, the carry that used to compensate holders for the position has turned into a cost. When the forward basis is negative, both the carry leg and the mark-to-market leg can lose at once: you pay to hold the position and it depreciates while you pay.
Number five: the 2Y shock transmission channel. The front end is the transmission line into everything else. The empirical relationship is stark: a US 2Y shock greater than 50bp in a regime where CPI is above 3 percent is associated with a 57 percent probability of a negative S&P return. The 2Y has already moved plus 119bp on the week. The next incremental plus 50bp would not be an isolated bond event. It would hit equities, hit the bond leg, and, with the correlation at plus 0.6, make both legs lose together, so that a book is margin-called on its bond position at the same moment its equity hedge is failing. There is no escape route inside the portfolio.
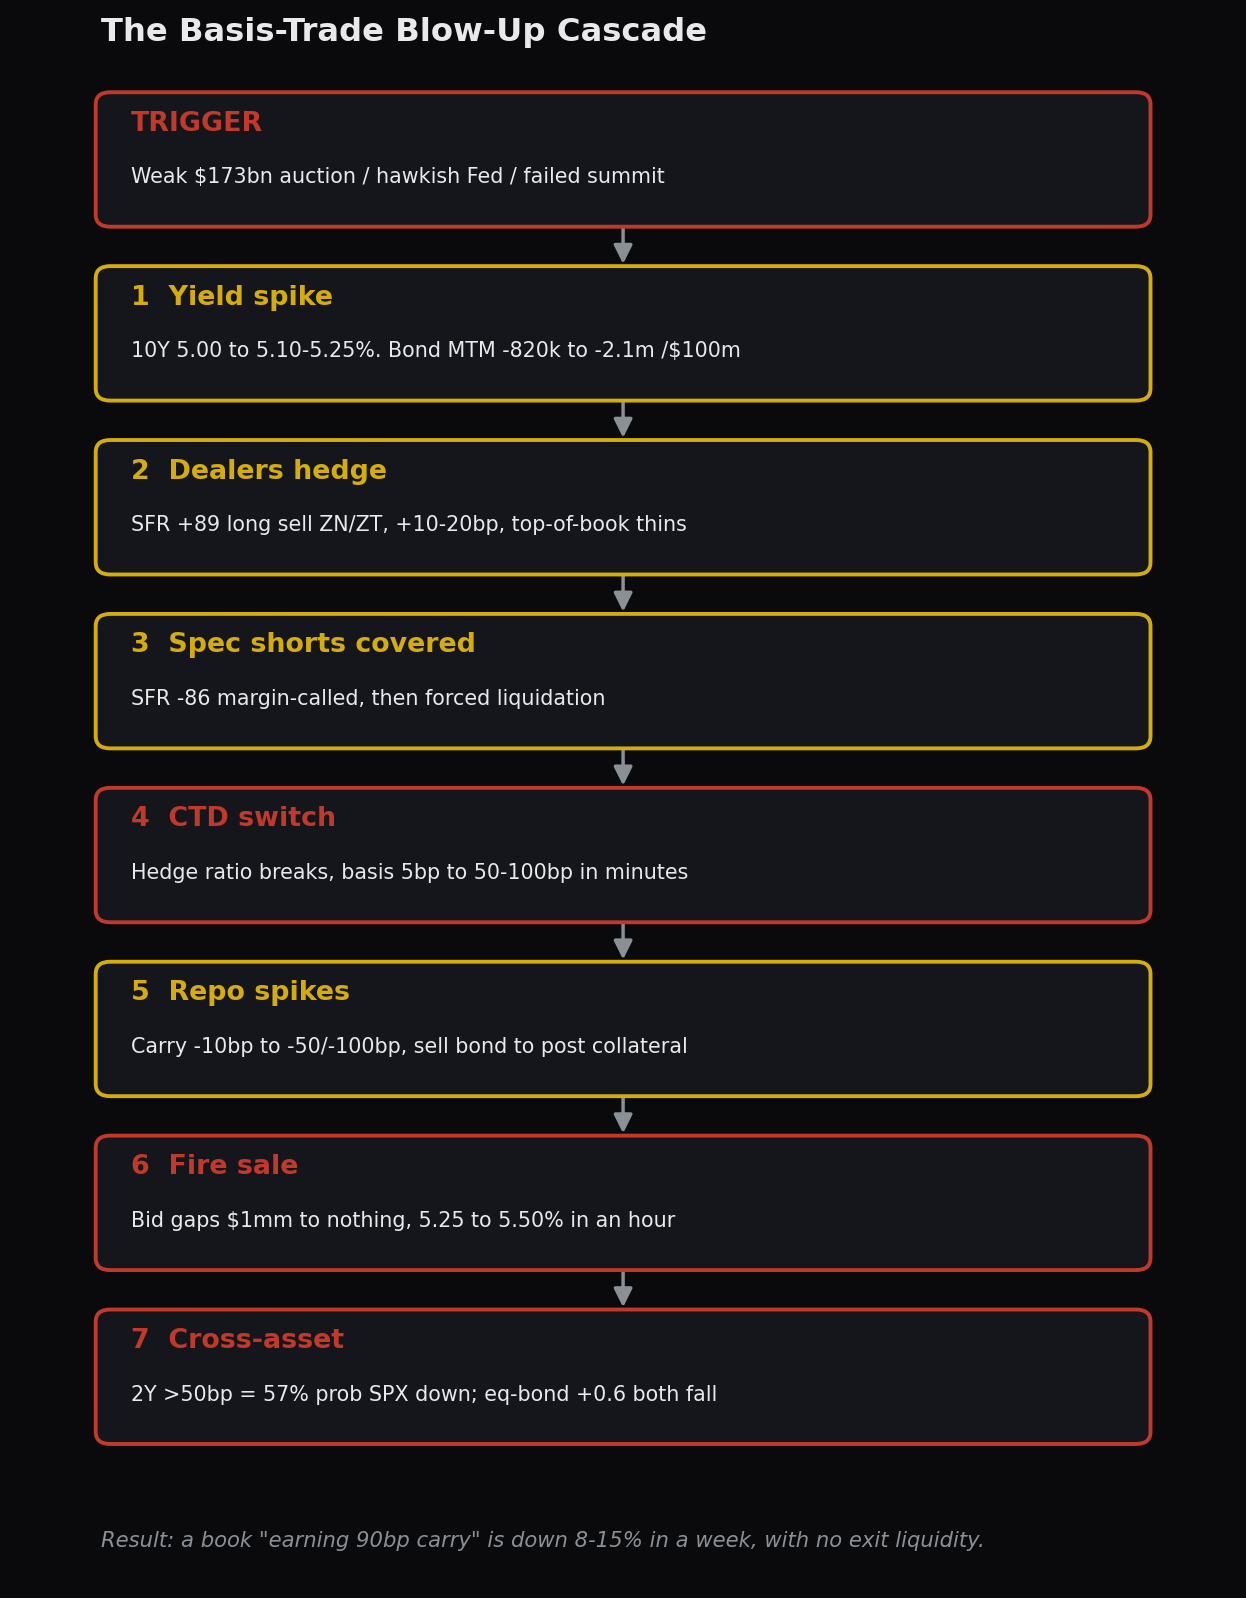
4. The blow-up sequence: seven steps
The cascade is not a metaphor. It is a specific, ordered sequence, and the point-value at each step tells you why it accelerates rather than dissipates.
Trigger. A weak $173bn auction, a hawkish Fed speaker, or a failed summit. Any one of the three is enough; next week offers all three.
Step 1. The 10Y moves from 5.00 to somewhere in the 5.10 to 5.25 range. On the $100m reference book the cash bond leg loses between minus $820k and roughly minus $2.1m, the futures leg offsets 80 to 90 percent of it, and the residual runs minus $80k to minus $200k. Survivable in isolation.
Step 2. Dealers, long SFR at plus 89, sell ZN and ZT futures to hedge the mark-to-market loss on their inventory. That selling adds another 10 to 20bp to yields, and each wave of it thins the top-of-book further, so the next trade prints into a gappier market.
Step 3. The spec shorts, minus 86 in SFR and minus 32 in TU, are first margin-called into covering, which briefly supports the market, and then forced to liquidate, which cascades into the cash market.
Step 4. The CTD switches. The front-end-led move changes which bond is cheapest to deliver, so the hedge ratio that was correct at inception is now wrong. The basis, orderly at 5bp, blows to 50 to 100bp in minutes, and the residual on the reference book jumps to minus $500k to minus $1m. This is the moment the hedge stops being a hedge.
Step 5. Repo funding spikes. SOFR jumps as balance sheet is withdrawn, the carry flips from a small positive to minus 10, then minus 50 to minus 100bp, and holders sell the bond to raise the cash to post against margin, which adds yet more supply.
Step 6. The fire sale. Everyone is selling the same 10Y and 30Y at once. The bid, already only $1mm deep, collapses from $1mm to $100k to effectively nothing. The 10Y travels from 5.25 to 5.50 inside an hour, and the reference book takes another roughly minus $2m.
Step 7. Cross-asset contagion. The 2Y is now more than 50bp higher, which in a CPI-above-3 regime carries a 57 percent probability of a negative S&P print. With the correlation at plus 0.6, equities and bonds fall together, and vol-control and risk-parity strategies de-risk mechanically, selling into the same illiquidity.
The result is that a trade advertised as earning 90bp of carry is down 8 to 15 percent in a single week, and there is no exit liquidity at which to realize the survivors.
5. The shared tail: one mechanism, two desks
The most important point for anyone running more than one book is that the basis trade and the dispersion trade are not two different risks. They are the same tail seen from two desks. Both earn their edge on low correlation and stable funding. Both are killed by the same two-part failure: correlation goes to one and liquidity goes to zero.
A dispersion book is long single-name volatility and short index volatility. It profits when names move independently while the index stays calm, and its profit and loss is roughly the realized idiosyncratic dispersion minus the implied dispersion, scaled, less the cost of the short index-vol leg. Its catastrophic loss comes on a correlated move, when the short index-vol leg blows out and the long single-name legs fail to offset. A basis or carry book, as shown above, earns a small convergent spread on heavy leverage and dies when a correlated selloff forces same-direction liquidation into a market with no depth. Written side by side, the two failure conditions are identical: everything that was supposed to move independently moves together, and the market that was supposed to absorb the unwind cannot.
The mechanics tie together through funding and through the correlation number itself. The FX carry leg is the clearest illustration of the funding channel. On $100m of notional at a USD/JPY spot of 157, one pip is worth roughly $6,400, so a 100 pip appreciation of the funding currency, on the order of 1 percent, is about $640k of loss on the hedge leg alone, before the bond leg is even considered. And the bond leg, per the table above, marks near minus $4.1m on a plus 50bp parallel shock per $100m. The funding anchor has been migrating from the yen toward the Swiss franc and Swedish krona, which means the trigger set now includes SNB and Riksbank hawkishness alongside the classic USD/JPY tail, and both central banks are live next week. The correlation channel is the equity-bond number: at plus 0.61, the reflexive instinct to de-risk into Treasuries is a fake hedge, because the Treasuries are falling in the same shock. The dispersion desk and the basis desk are both, in effect, short the same correlation.
That shared structure produces a common early-warning set and, more usefully, three concrete tripwires for the week ahead. The first is the funding tripwire: USD/JPY pushing toward 160 with an intervention response, or SNB and Riksbank turning hawkish, either of which bids the funding currency and flips the carry. The second is the transmission tripwire: a US 2Y shock of plus 50bp coming off the auctions, which is the leg that carries the 57 percent equity-transmission probability. The third is the liquidity tripwire: top-of-book depth staying pinned near $1mm, its thinnest reading, so that any forced flow gaps rather than fills. The framing to keep in mind is arithmetic. One tripwire firing is enough to start the cascade. Two firing together is the explosion, because that is the configuration in which correlation goes to one and liquidity goes to zero at the same instant.
6. What would de-escalate versus confirm
The week resolves in one of two directions, and the tells are specific enough to trade against. The table below reads as a running scorecard: the more the right-hand column prints, the closer the market moves to the cascade in Section 4.
| Signal | De-escalates | Confirms |
|---|---|---|
| Auctions | Strong bid-to-cover, low tail | Weak cover, high tail, or re-tender |
| Fed tone | Data-dependent, patient | More hikes, terminal above 4.5 percent |
| 10Y level | Holds below 5.00 | Breaks 5.25 |
| 2Y level | Stabilizes below 4.80 | Plus 50bp shock |
| Spec positioning | Shorts cover | Shorts extend |
| Top-of-book depth | Recovers above $5mm | Stays below $2mm |
| Equity-bond correlation | Falls back toward zero | Stays above plus 0.5 |
| Forward basis (FF +3M) | Turns positive | Deepens to minus 20 to minus 30bp |
The two signals to weight most heavily are the auction results and the top-of-book depth, because they map directly onto the two halves of the shared-tail failure. A clean set of auctions with recovering depth means the market absorbed the supply and the liquidity vise loosened. A tailing auction into a book that stays below $2mm means the supply is not being absorbed and the amplifier is still armed.
7. Bottom line and defensive posture
Blow-up risk is elevated and building, expressed as a progressive squeeze rather than a single-day detonation, with next week's $173bn of auctions as the most likely catalyst. The point-value summary is the whole argument in one line: a 50bp adverse move marks the bond leg near minus $4m per $100m, of which 80 to 90 percent is hedged in a clean parallel case, leaving minus $400k to minus $800k unhedged, but the margin calls that the move triggers force realization of those losses at exactly the moment liquidity is worst. The main risk is not the initial mark. It is dealer positioning, SFR plus 89 against spec shorts of minus 86, running through a $1mm top-of-book that turns an orderly repricing into a gap.
The defensive posture follows directly from the mechanics, not from a view. Shorten duration, favoring the 2 to 5Y over the 10 to 30Y sector where the supply overhang is worst and the point-value damage per basis point is largest. Reduce leverage, because the kill mechanism is the margin-call spiral and not the initial mark to market; the position that survives a 50bp day is the one whose margin buffer exceeds the move, and at 50x that buffer does not exist. Avoid flatteners into the auctions, because back-end supply is a steepening force and steepening is the flattener's loss condition. And treat any plus 50bp move in the 2Y as a hard stop, because that is the level at which the 57 percent equity-transmission probability turns a rates problem into a cross-asset one, and the correlation at plus 0.6 removes the hedge that would otherwise let you sit through it.
Methodological note
The dollar point-value figures throughout this piece are mechanical illustrations. They are computed from the quoted price levels of the week, a USD/JPY spot near 157, a 10Y yield near 5.0 percent, and a reference duration near 8.2, applied under standard conventions: futures point value of $1,000 per point and $31.25 per 32nd, actual/360 carry accrual, and DV01-based parallel-shift estimates for the $100m reference book. Every level and every basis-point move cited is traceable to dated reports in the September 15 to 19, 2026 research index. The repo daily-carry example is worked directly from its inputs, an 85bp net spread on $100m financed at actual/360, which yields roughly $2,361 per day, against which a plus 50bp session marks the bond leg near minus $4.1m, a margin call on the order of 1,700 times the daily carry. No figure here is a forecast, and none has been fabricated; the point-value tables are stress illustrations of how the structures behave under specified shocks, not predictions that those shocks will occur.